After signing in or by clicking on "
DASHBOARD"

you can access the relevant area:
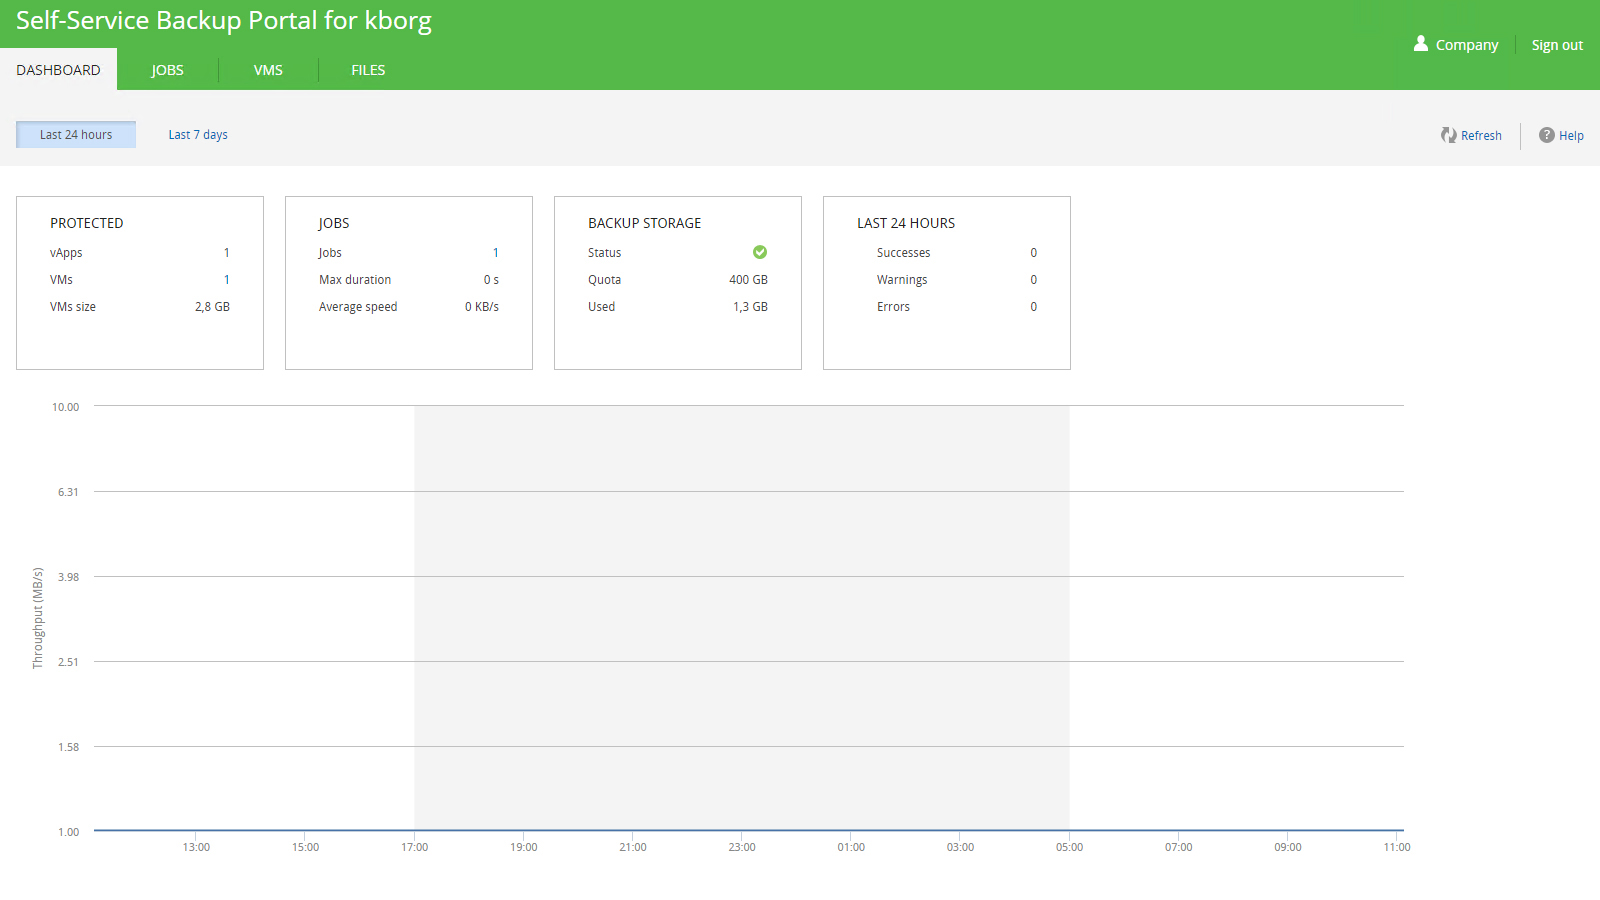
In this section, you can view statistics for the service as well as its status. You can see the statistics for the last 24 hours or the last 7 days by choosing from one of the two options available.

The information provided tells you about:
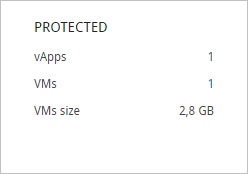
- PROTECTED - the number of vApps and VMs for which there is an active Job, and the total size of the VMs for the Job.
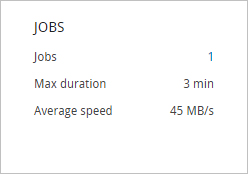
- JOBS - the number of active Jobs, their duration and their speed.
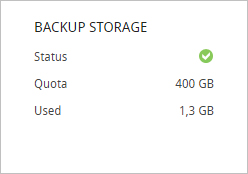
- BACKUP STORAGE - the status of the Storage available for the job, with the quota of space assigned and the space used.
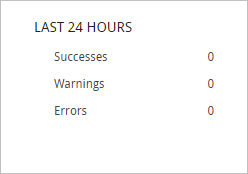
- LAST 24 HOURS / LAST 7 DAYS - the number of Jobs broken down by status (completed, completed with warnings, failed).
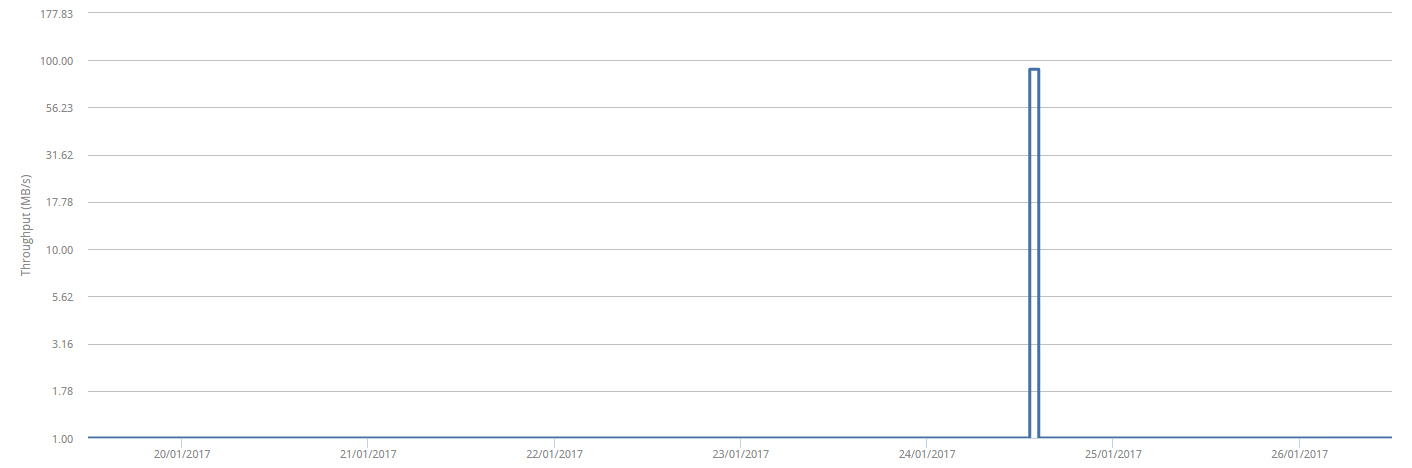
In the bottom part of the screen, there is a graph showing the Jobs with their data throughput capacity (MB/s) over time; the graph can show information for the last 24 hours or the last 7 days (depending on which option you have chosen in the top left corner).
For more technical and sales information please
contact our team of experts. To view the official documentation about using the Web Panel, provided by Veeam, click
here.