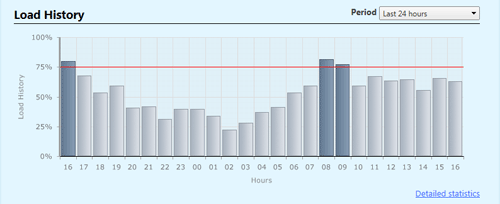
After going to the
load balancer management section, to see the load history chart and the statistics proceed as shown below: in the technical details page of the load balancer go to the "
Load History" section.

The chart will show a red line which corresponds to the load threshold level: we recommend that you monitor the load on the machines and intervene (for example by increasing the number of Servers that are connected to the load balancer) to avoid and prevent possible overloads.
We remind you that
the balancers can support up to 20.000 sessions per second and around 1 Gb/s of traffic; if you require greater performances you can
contact our team of experts, to find a customized solution.
By selecting one of the available options in the "
Period" list you can change the displayed period up to the last 30 days.
If you need a more detailed analysis divided per load balanced Cloud Server/Dedicated Server and the applied rules simply click on the "
Detailed statistics" link found in the bottom right corner.