The statistics related to the Cloud Server make it possible to see what resources a specific Cloud Server is using:
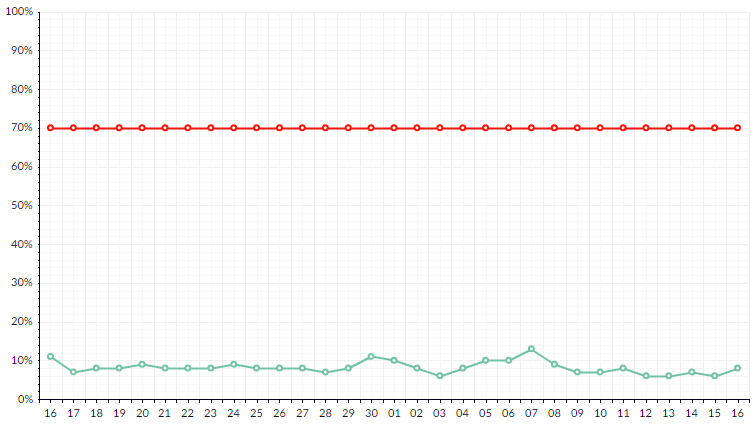
- Processor - vCPU (core) load: calculated as a percentage;
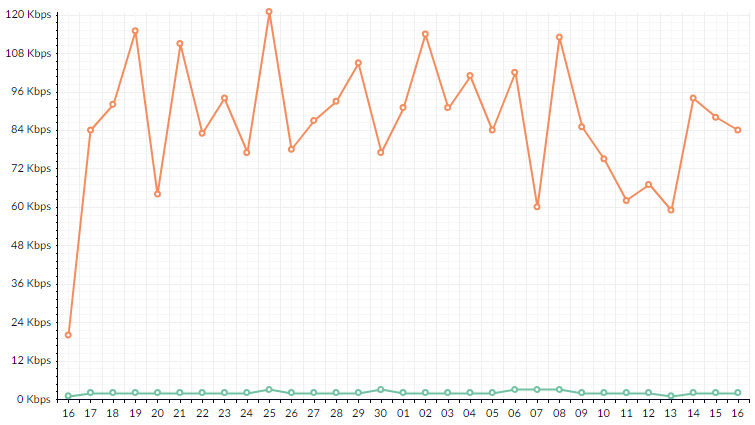
- Network - Bandwidth used: calculated in Kbit per second;
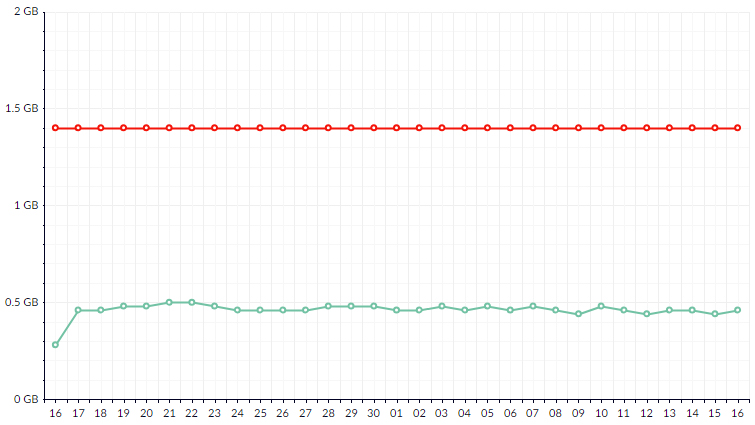
- Memory - RAM used: calculated in GB;
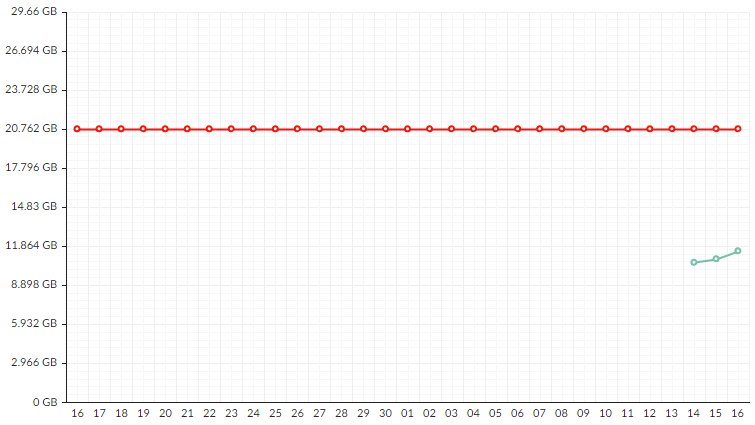
- Disks - Partition used: calculated in GB per partition*;
* The statistics relating to the disk space used refer to the monitoring of the individual partitions created, formatted and mounted on the disks with at least 300 MB of space.
PLEASE NOTE: the statistics relating to "Memory" and "Disks" are currently only available for Cloud Servers based on VMware technology.
To see the statistics, all you need to do is go to the Cloud Server technical datasheet and click on "
Statistics".

The statistics are updated every 3 minutes and can be viewed by month, week, day or hour.

We recommend monitoring the use of resources and taking action if this use is excessive.
By checking the graphs, you can optimize both the performance and the costs of the Cloud Server.
Here are some examples of the graphs you can see in "
Statistics".
Processor

green line: indicates the use of the resource by the Cloud Server;
red line: indicates the security threshold that the system recommends as being optimal;
Network

green line: indicates incoming data traffic;
red line: indicates outgoing data traffic;
Memory

green line: indicates the use of the resource by the Cloud Server;
red line: indicates the security threshold that the system recommends as being optimal;
Disks

green line: indicates the use of the resource by the Cloud Server;
red line: indicates the security threshold that the system recommends as being optimal;
The "
PRINT GRAPH" button underneath each graph, lets you download it as a PDF.

This function can be useful if a user needs to see and compare analyses corresponding to periods of longer than a week.