Cloud Server statistics
The procedure described in this guide applies only to OpenStack Cloud Server.
Cloud Server statistics allow you to monitor machine resource usage through dedicated charts.
Statistics are updated every 3 minutes and can be viewed on a monthly, weekly, daily or hourly basis.
To view VMware Cloud Server statistics, see the guide on
how to monitor a VMware Cloud Server.
Statistics you can view
You can view statistics for the following resources:
- Processor - vCPU load (cores), expressed as a percentage;
- Network - bandwidth usage, expressed in Kbit per second.
How to view Cloud Server statistics
- Go to the details page of the Cloud Server whose statistics you want to view;
- select Statistics below the Cloud Server name;
- under Choose the statistics that you want to see:, select Processor or Network;
- under Period:, select the period whose statistics you want to view:
- Last Month;
- Last week;
- Last day;
- Last hour.
How to read the charts
The charts allow you to monitor Cloud Server resource usage and identify situations where usage is high.
Processor
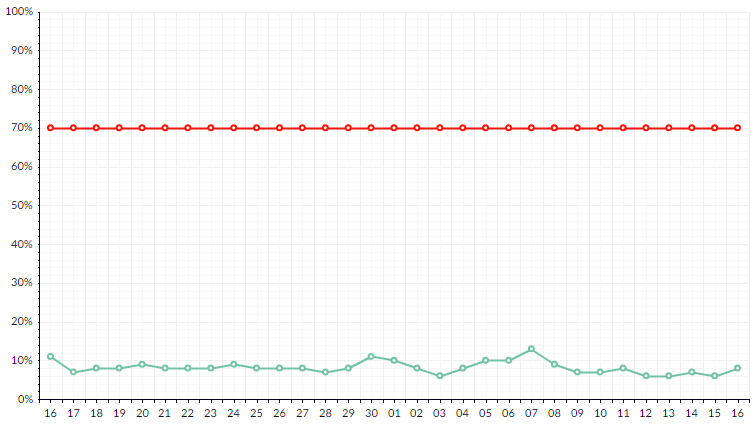
green line: shows the resource usage by the Cloud Server;
red line: shows the safety threshold recommended by the system;
Network
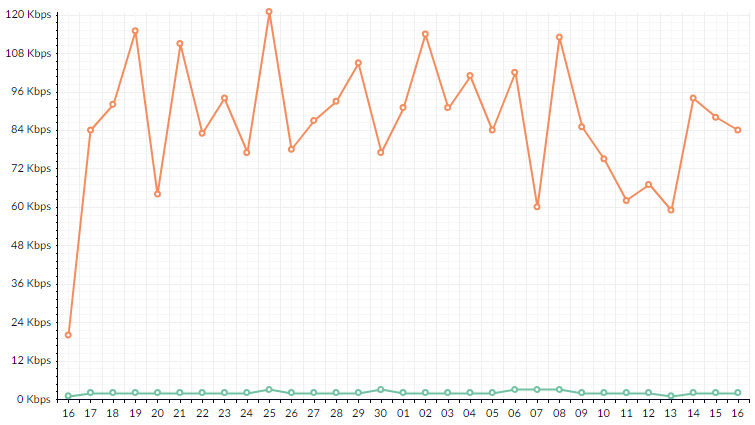
green line: shows incoming data traffic;
red line: shows outgoing data traffic;
How to download the charts
The PRINT GRAPH button at the bottom of each chart allows you to download the chart in PDF format.
This function can be useful for saving and comparing statistics for different periods.