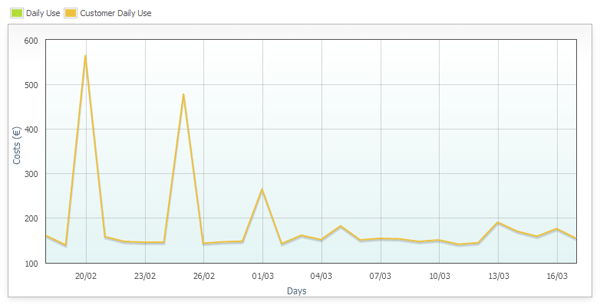
To see the Daily Spend trends proceed as follows:
-
login to the "Partner Panel"
-
go to the section "Credit"

-
select the heading "Dashboard" from the menu on the left

-
a table page with three separate areas will open:
-
Daily Spend graph
-
Credit Summary
-
Users Summary
Daily Spend Graph

From this section, you can monitor the Daily Spend trends divided in the graph by:
-
Daily Spend: the amount that the Partner pays daily for services that are resold (these values do not count any discounts applied in the top-up process or other trade agreements).
-
Customer Daily Spend: the amount that the Partner collects from its customers for their services.
The difference between the two values indicates the Partner's profit.
Credit Summary

In this area there are two reports related to credits:
-
Credit Summary: the credit values, credit limit, Reseller's hourly and monthly consumption projection.
-
User Credit Summary: the total credit and credit limit values for all users.
Summary of resources in use

Represents a report of all the resources used by the Users of the Partner.