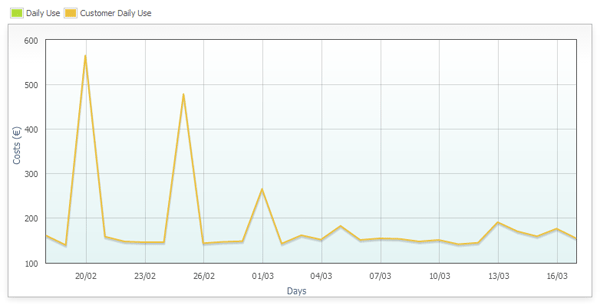
To see the Daily Spend trends proceed as follows:
-
login to the "Partner Panel"
-
go to the section "Credit"

-
select the heading "Statistics" from the menu on the left

a page like the one below will open


From this section, you can monitor the Daily Spend trends divided in the graph by:
-
Daily Spend: the amount that the Partner pays daily for services that are resold
-
Customer Daily Spend: the amount that the Partner collects from its customers for their services
The difference between the two values indicates the Partner's profit.
At the top and you can search by filtering various parameters:
-
Start Date: the start date of the period that we want to monitor
-
End Date: the end date of the period that we want to monitor
-
Costumer: the Customer you are interested in
-
Resource type: the Resource we want to monitor
-
Datacenter: the Datacenter that we want to monitor
-
Currency: the Currency in which we want the report to be counted
By editing the various parameters the new graph of the spending trend will be displayed and the lower part will be updated.
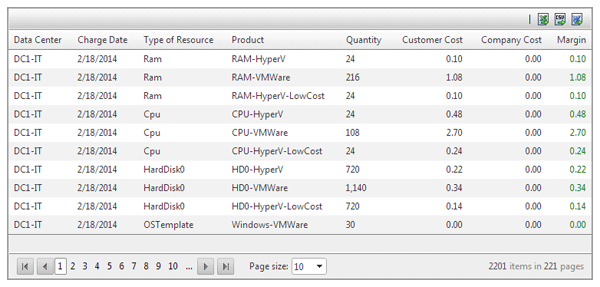
The report generated at the bottom lists the following items:
-
Datacenter: the Datacenter on which the Resource is present on a given day
-
Charge Date: the date on which the resource was provided
-
Resource type: the type of resource provided on a given day
-
Product: the product name
-
Amount: the amount of resources allocated on a given day
-
Customer Cost: the Cost the customers have paid to the Partner on a given day for a given Resource
-
Company Cost: the cost that the Partner has paid to provide a Resource to their Customers on a given day
-
Profit Margin: the difference between the Customer Cost and the Company Cost, the Partner's profit margin for a given resource provided on a given day
You can export the data generated into various formats (.xls, .csv and .doc) by using the icons at the top right corner of the report:


